Field Ops: SWP Results
Vitidore’s field operations team collected Stem Water Potential data throughout 2022 as part of an effort to inform farmers and improve our machine-learning models. This is part of a series detailing the results of our field operations.
Stem water potential (SWP) readings measure plant water status, a metric for water stress in crops. It is analogous to blood pressure in humans, with a higher value indicating more stress- i.e. less water available to the plant. Vitidore measured SWP of wine grape vines on eight farms in 2022. Vines were either surrounded by alleyways planted with Oakville Bluegrass (ob), a novel perennial cover crop, or alleyways under normal farm management (control). The control management varied between sites in terms of mowing, disking, and types of native vegetation present. We visited each farm 5-6 times, collecting 82-108 data points per site.
The final results indicate no statistically-significant difference in SWP between ob and control in four cases, and an increase in ob SWP in the other four cases. Below are two sets of data from anonymized farms showing these results. Figures 1 and 2 below each contain a boxplot, density plot, and time series plot of raw SWP measurements that we collected from two individual farms representative of these trends.In the first example (Figure 1), no significant statistical difference (denoted by “ns”) was observed between SWP in Oakville bluegrass and control vines (Figure 1a). Both treatments had data distributions of similar range and magnitude (Figure 1b) and remained similar throughout the monitoring season (Figure 1c).
In the second example (Figure 2), SWP was higher in Oakville bluegrass vines vs control vines for data aggregated over the entire season (denoted by “*”)(Figure 2a). The data distribution peak for Oakville bluegrass treatments occurs at higher SWP than in the control. Additionally, the Oakville bluegrass treatment data distribution is wider, which indicates a larger range and more variability in SWP measurements (Figure 2b). The Oakville bluegrass and control plots followed similar trends over time, with Oakville bluegrass plots consistently showing higher SWP measurements at each interval (Figure 2c).
When looking at all site locations for the entire monitoring season, there was a difference between Oakville bluegrass and control vines where Oakville bluegrass was observed to be greater than the control (Figure 3a). The season's data distribution reveals that high value SWP measurements are more prevalent in the Oakville bluegrass data set than the control (Figure 3b). While this may indicate higher plant water stress in Oakville bluegrass vines, it's important to consider the variability of our control sites, which contributes to uncertainty. To continue our understanding of the effects of Oakville bluegrass and control alleyways on vine SWP, next steps could include improving control group consistency in regards to weed/land management and expanding the monitoring season to include a wider range of seasonal stressors. We share these individualized graphs along with a breakdown of the results with our partner farmers, with the goal of helping to inform them about the impact of their management decisions.
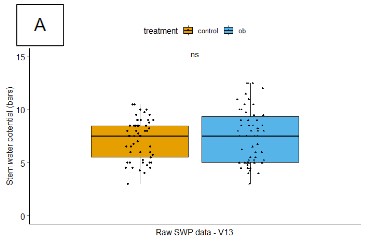
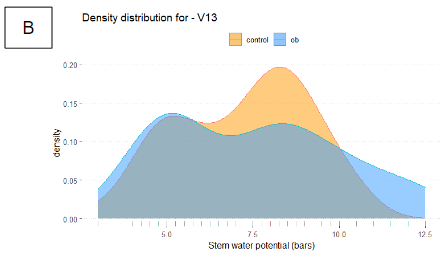
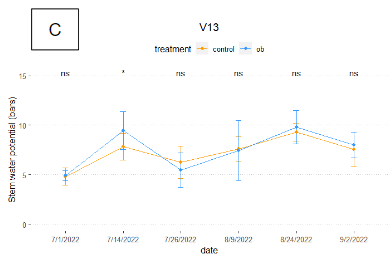
Figure 1: “V13”
(a) Boxplot, (b) Density Plot, & (c) Time Series plot of SWP where no significant difference was observed in vines near control vs Oakville bluegrass alleyways. ns = no significant statistical difference between treatment groups. An increase in "*" indicates a larger significant difference between treatments.
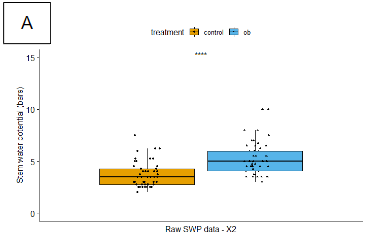
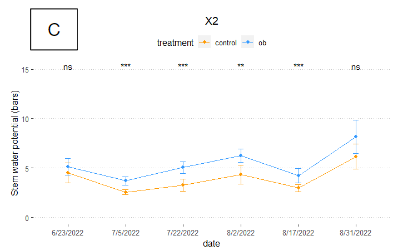
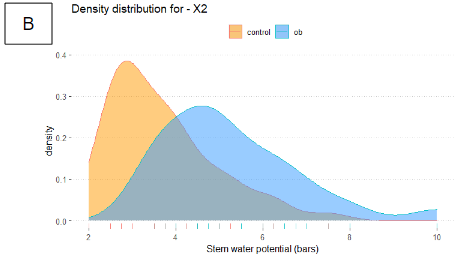
Figure 2: “X2”
(a) Boxplot, (b) Density Plot, & (c) Time Series plot of SWP where a significant difference was observed in vines near control vs Oakville bluegrass alleyways. An increase in "*" indicates a larger significant difference between treatments.
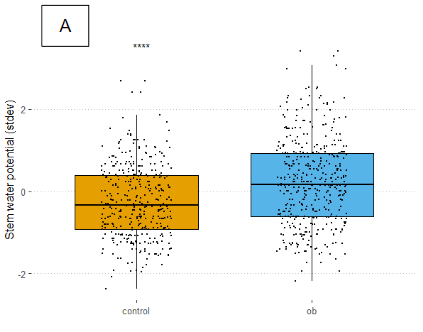
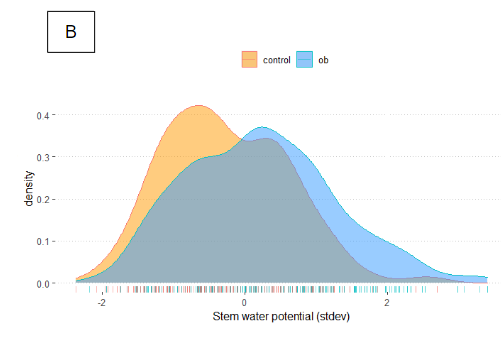
Figure 3: Aggregated SWP data from all eight sites.
(a) Boxplot & (b) Density Plot: Aggregated SWP data is scaled to standard deviation units to account heterogeneity between locations, putting all data into one "scale" or range so that they can be compared.